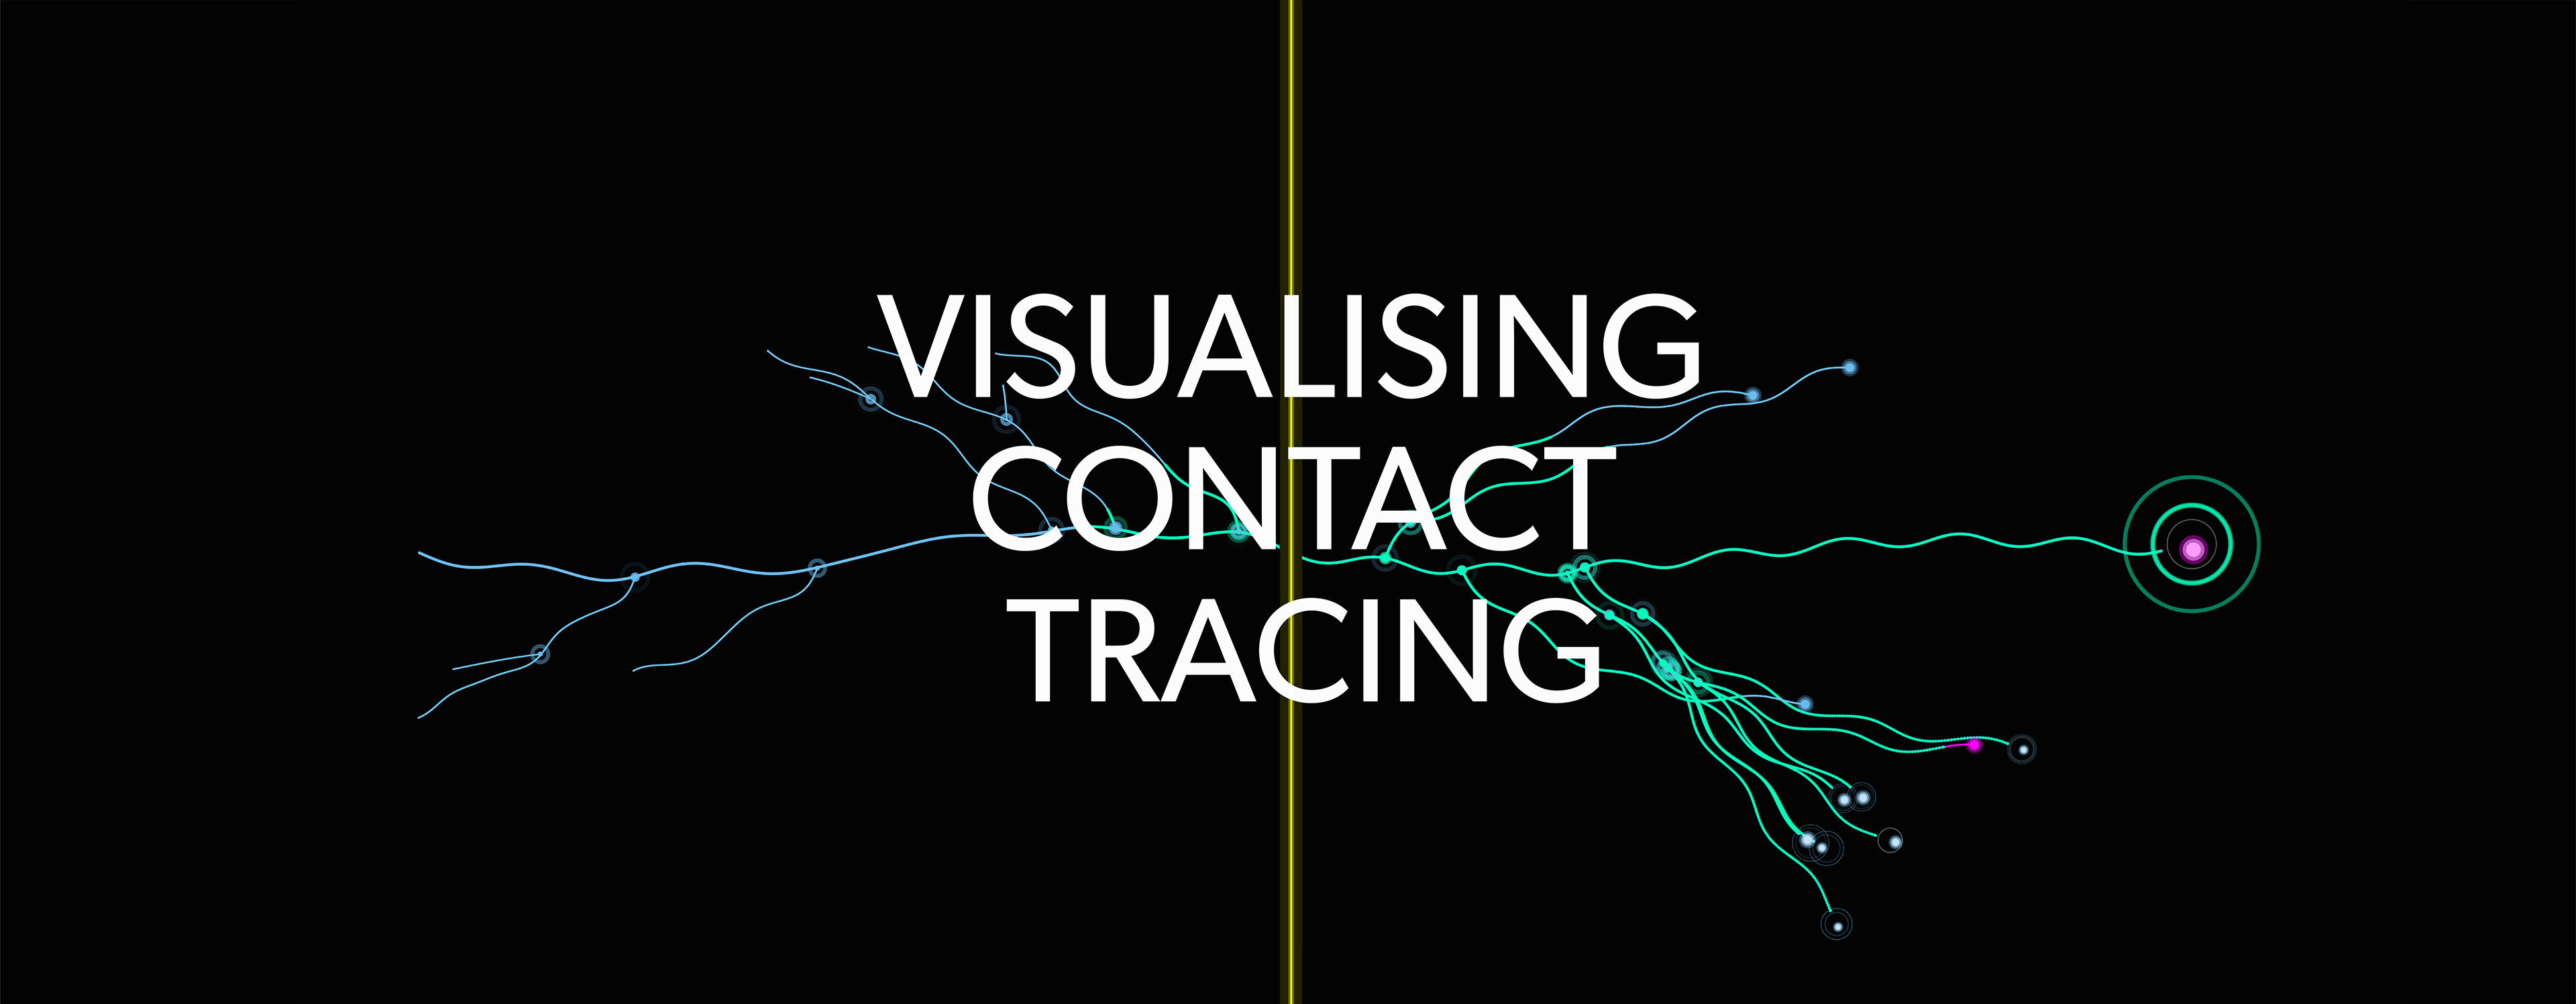
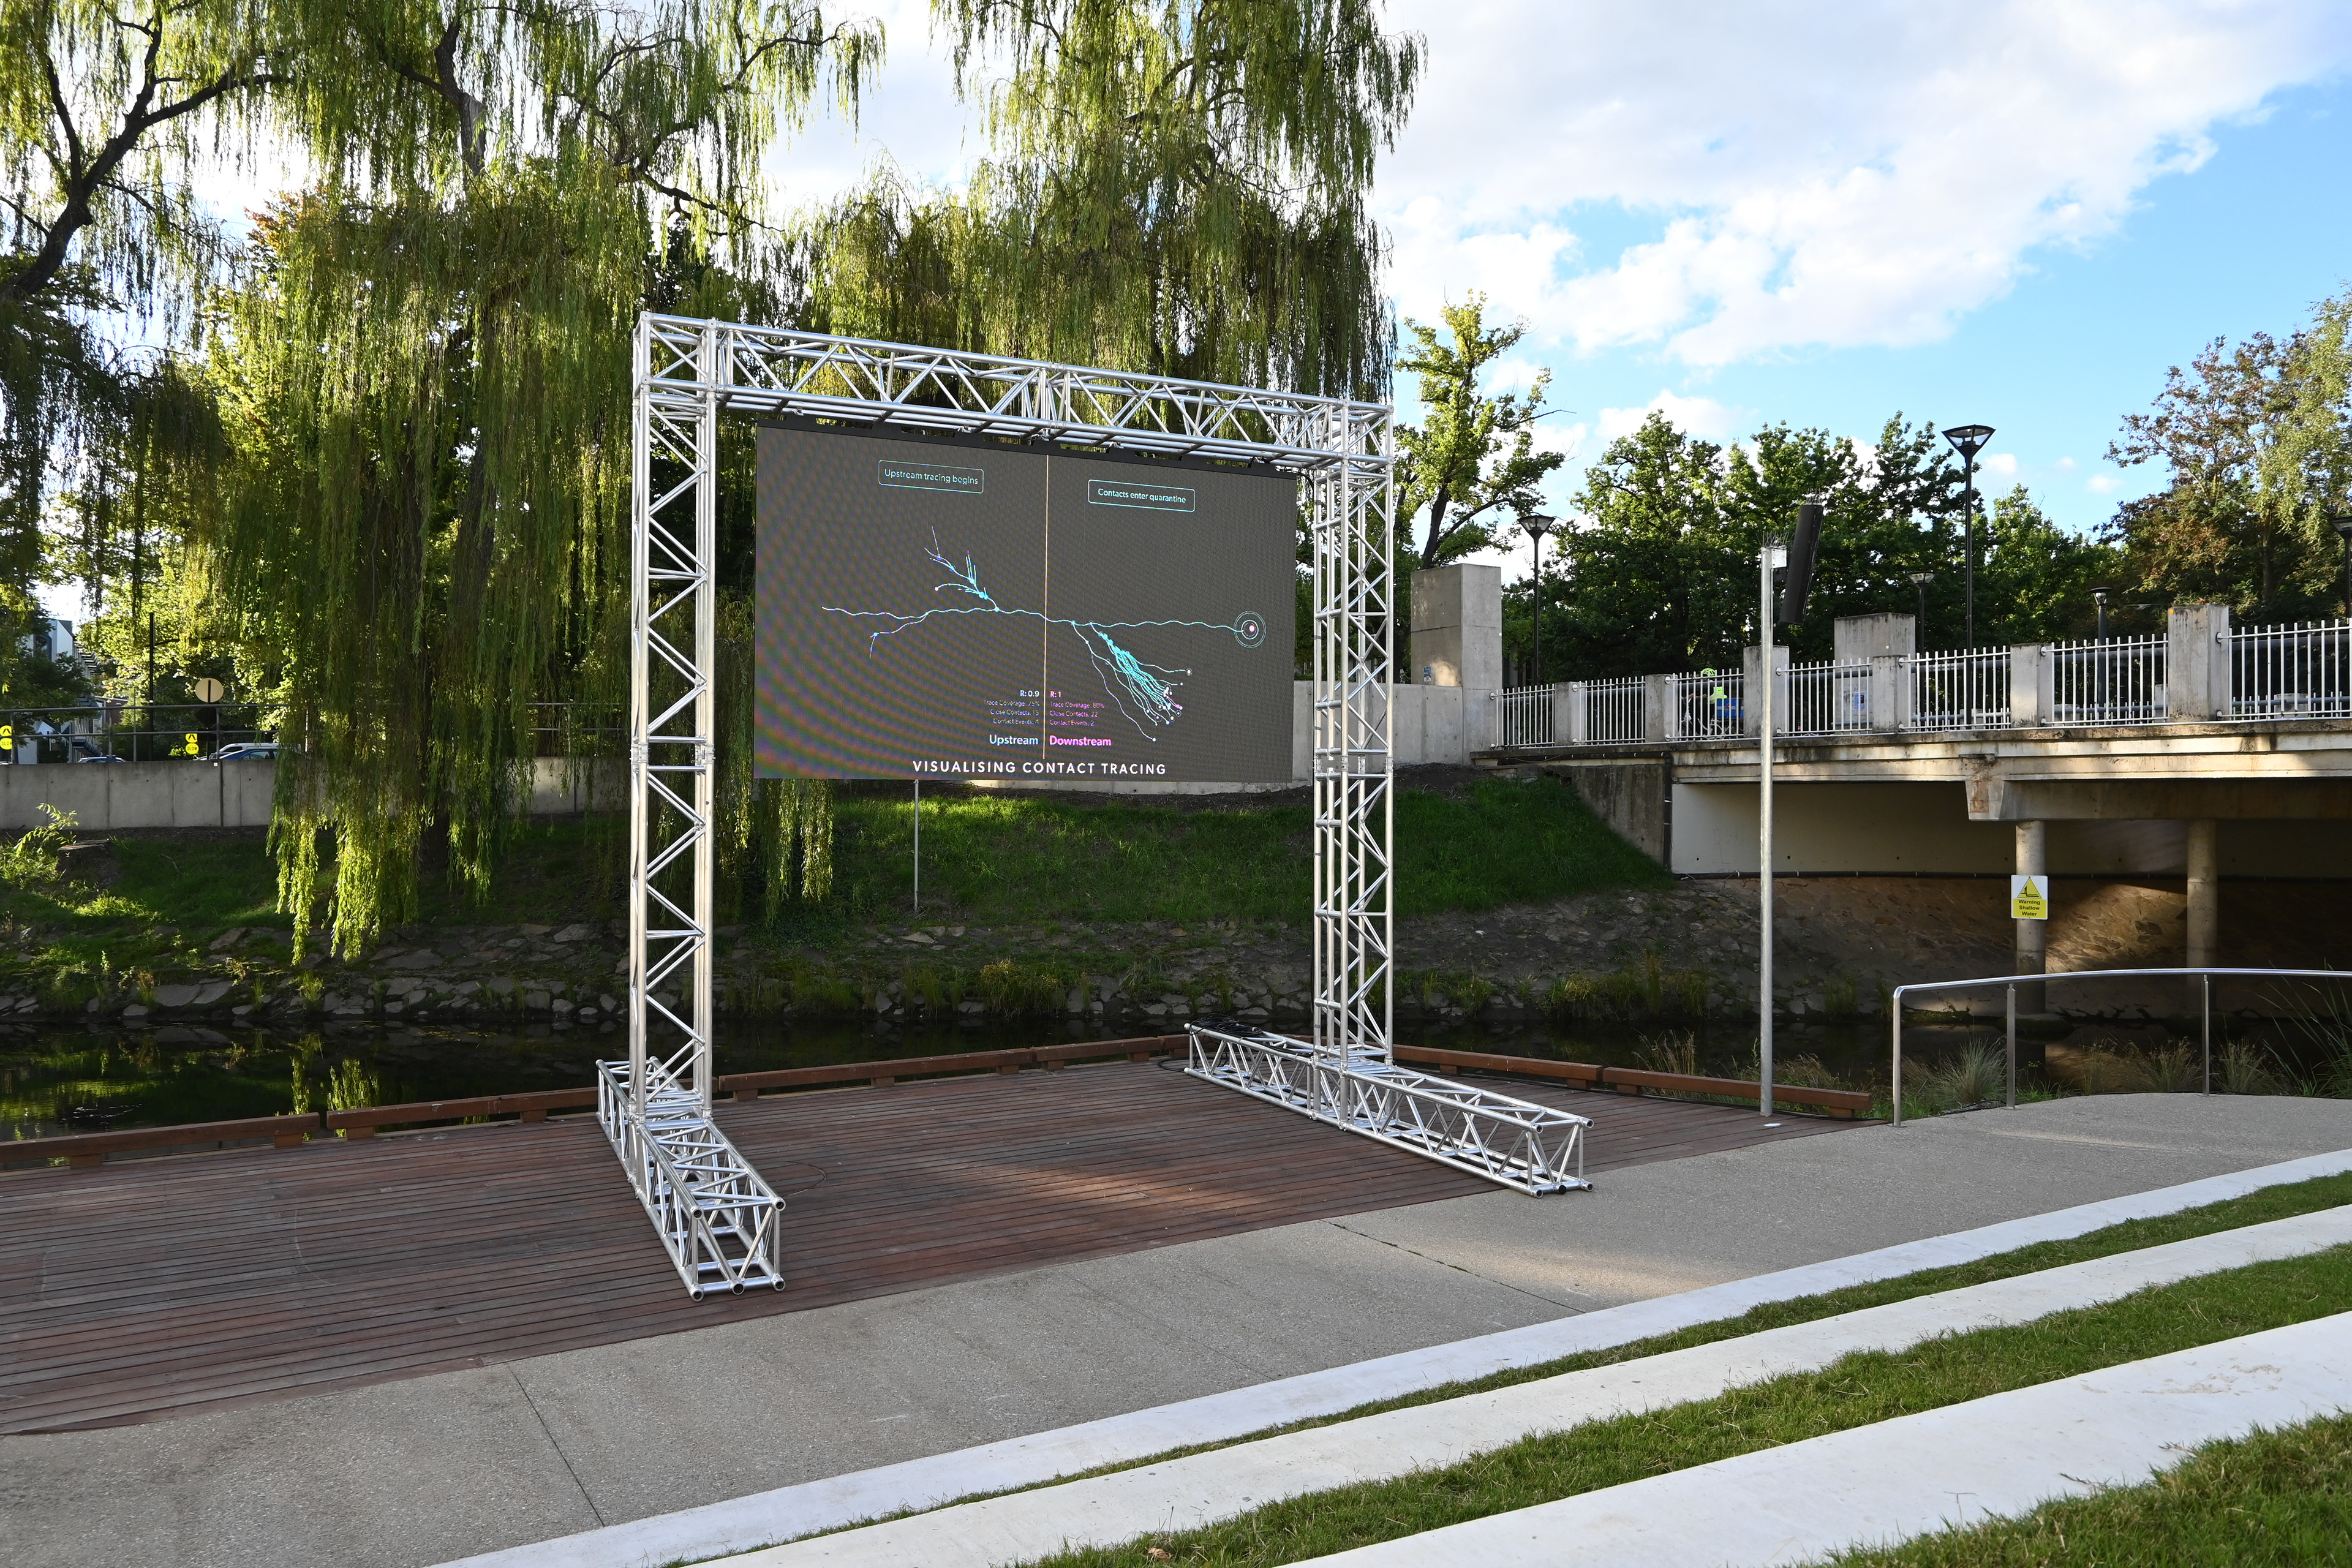
A visualisation of the process of contact tracing exhibited at Questacon Goes Viral and ANU After Dark at Enlighten.
This work was developed at the Australian National University with the Research School of Population Health and the School of Art and Design.
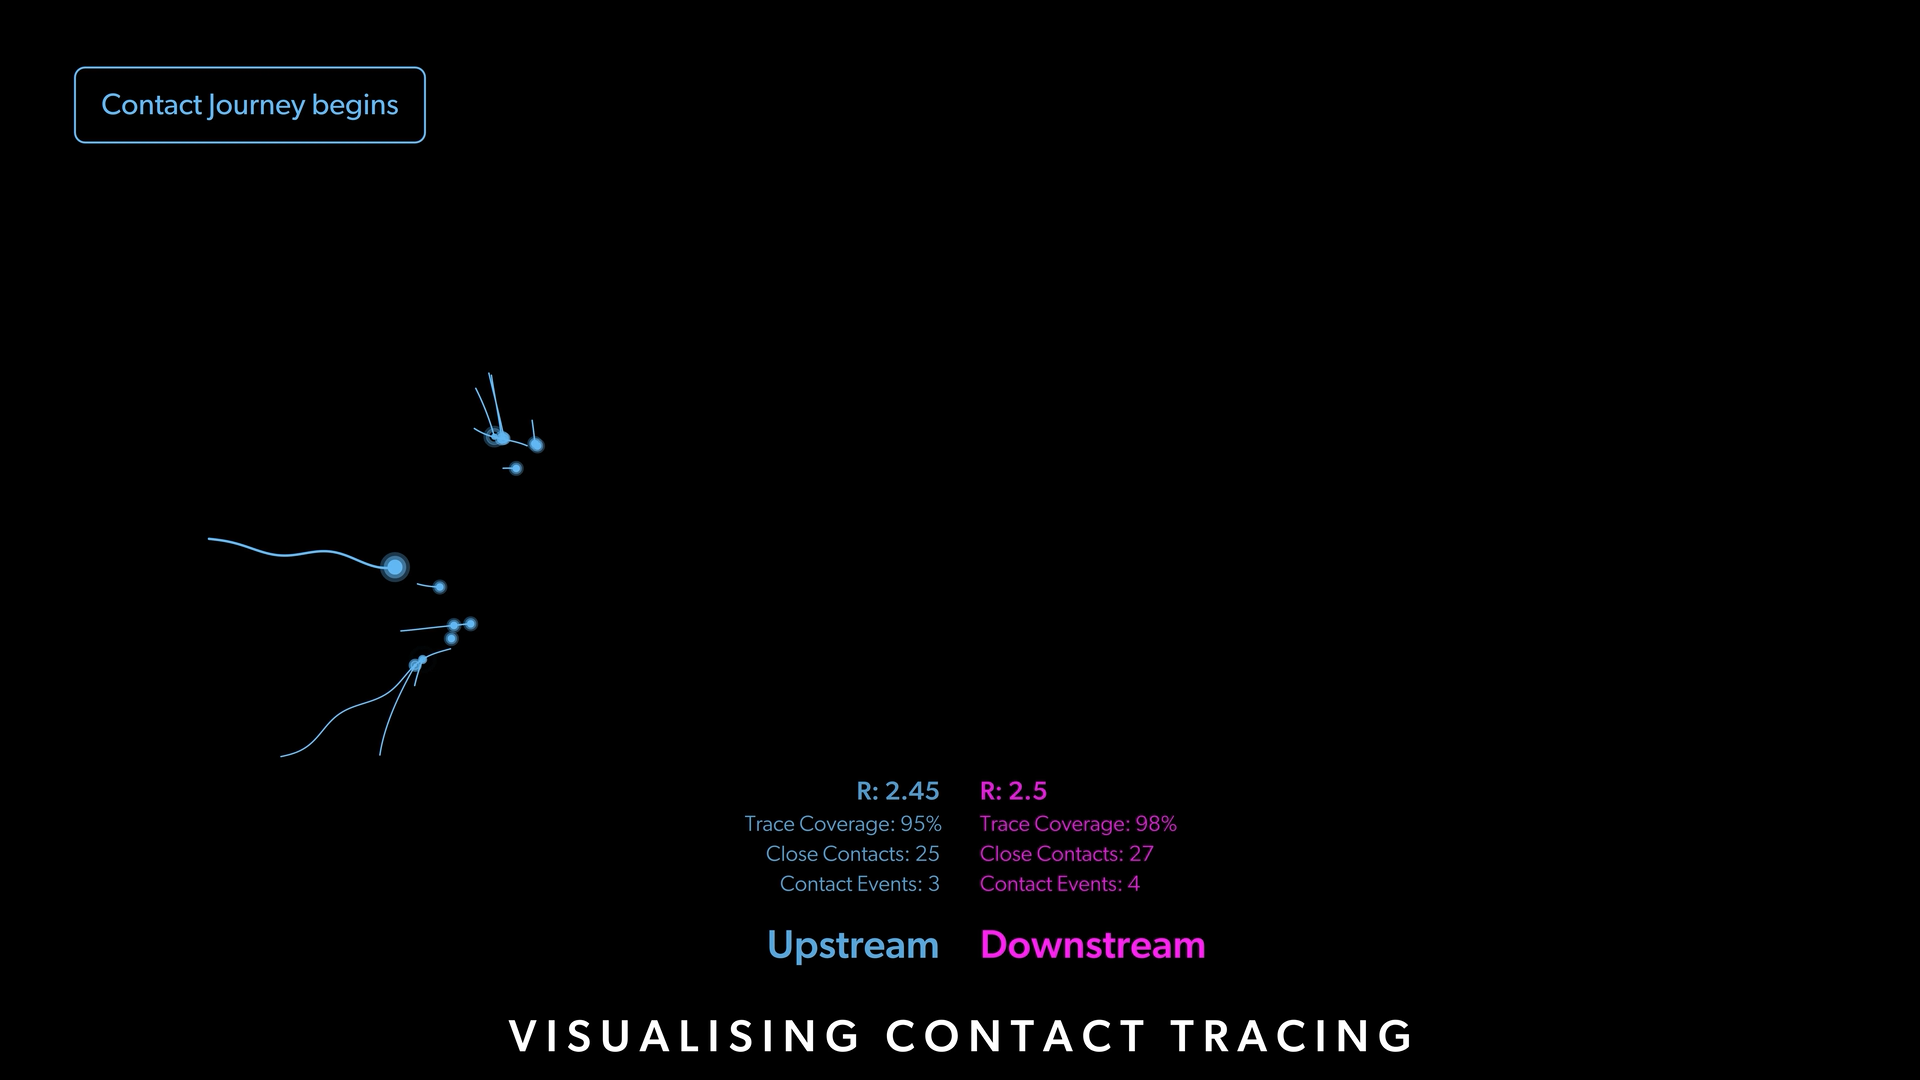
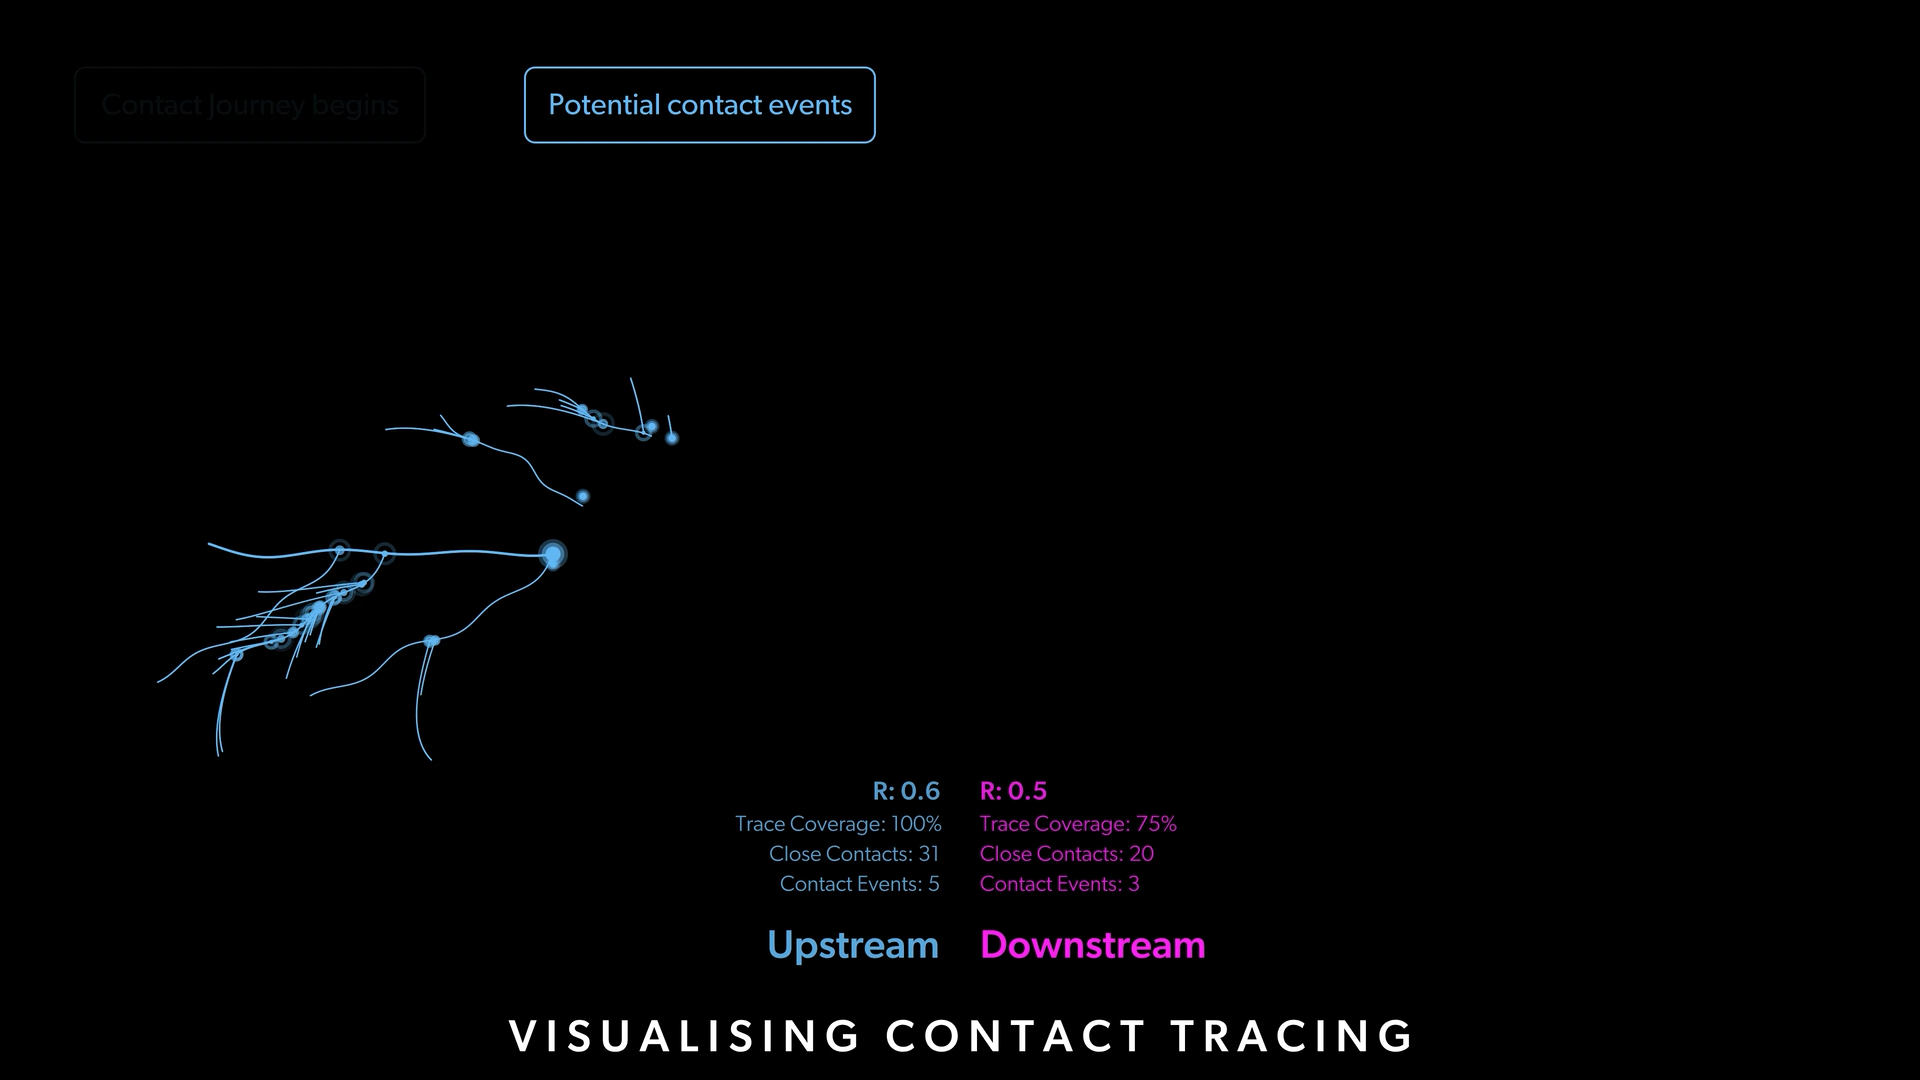
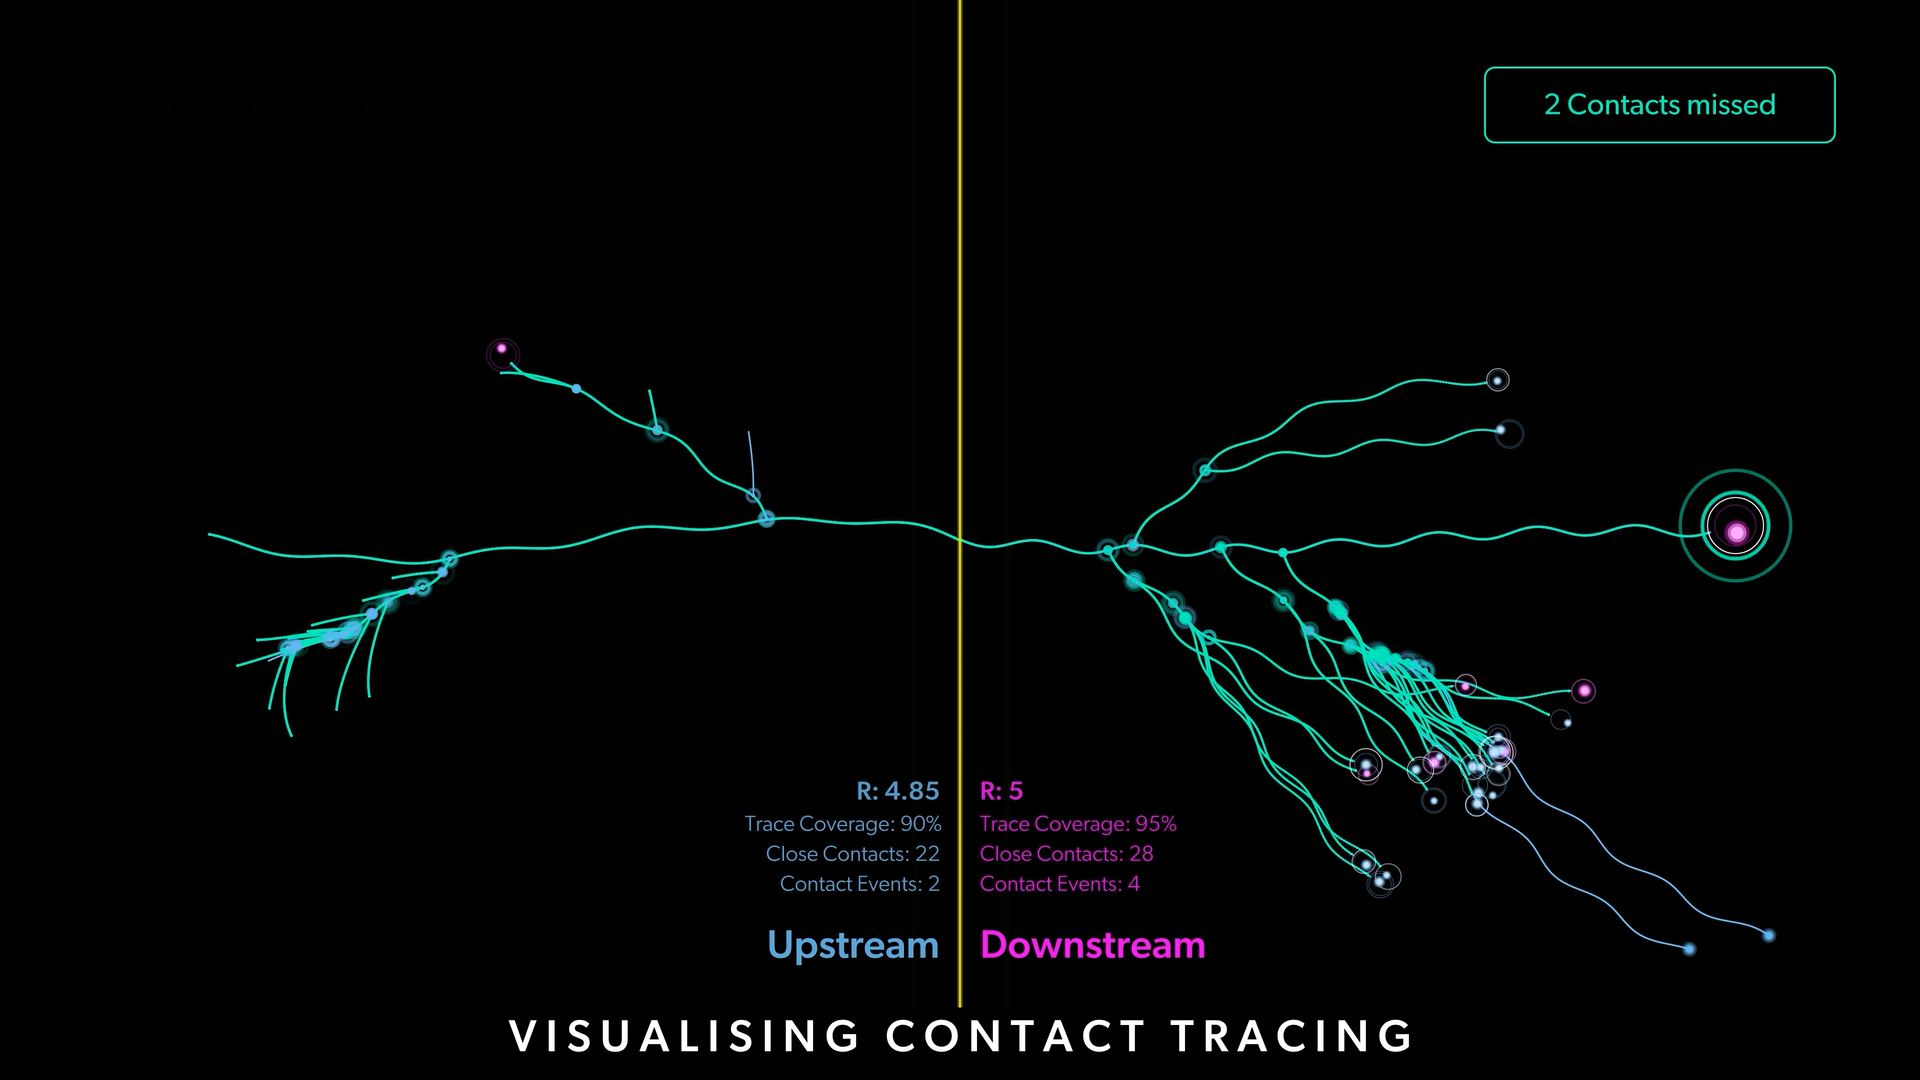
The visualisation is made using the P5 JavaScript library allowing different parameters to be entered for each scenario. These look at how variables in trace coverage contact events and the R number can affect the spread of a virus.
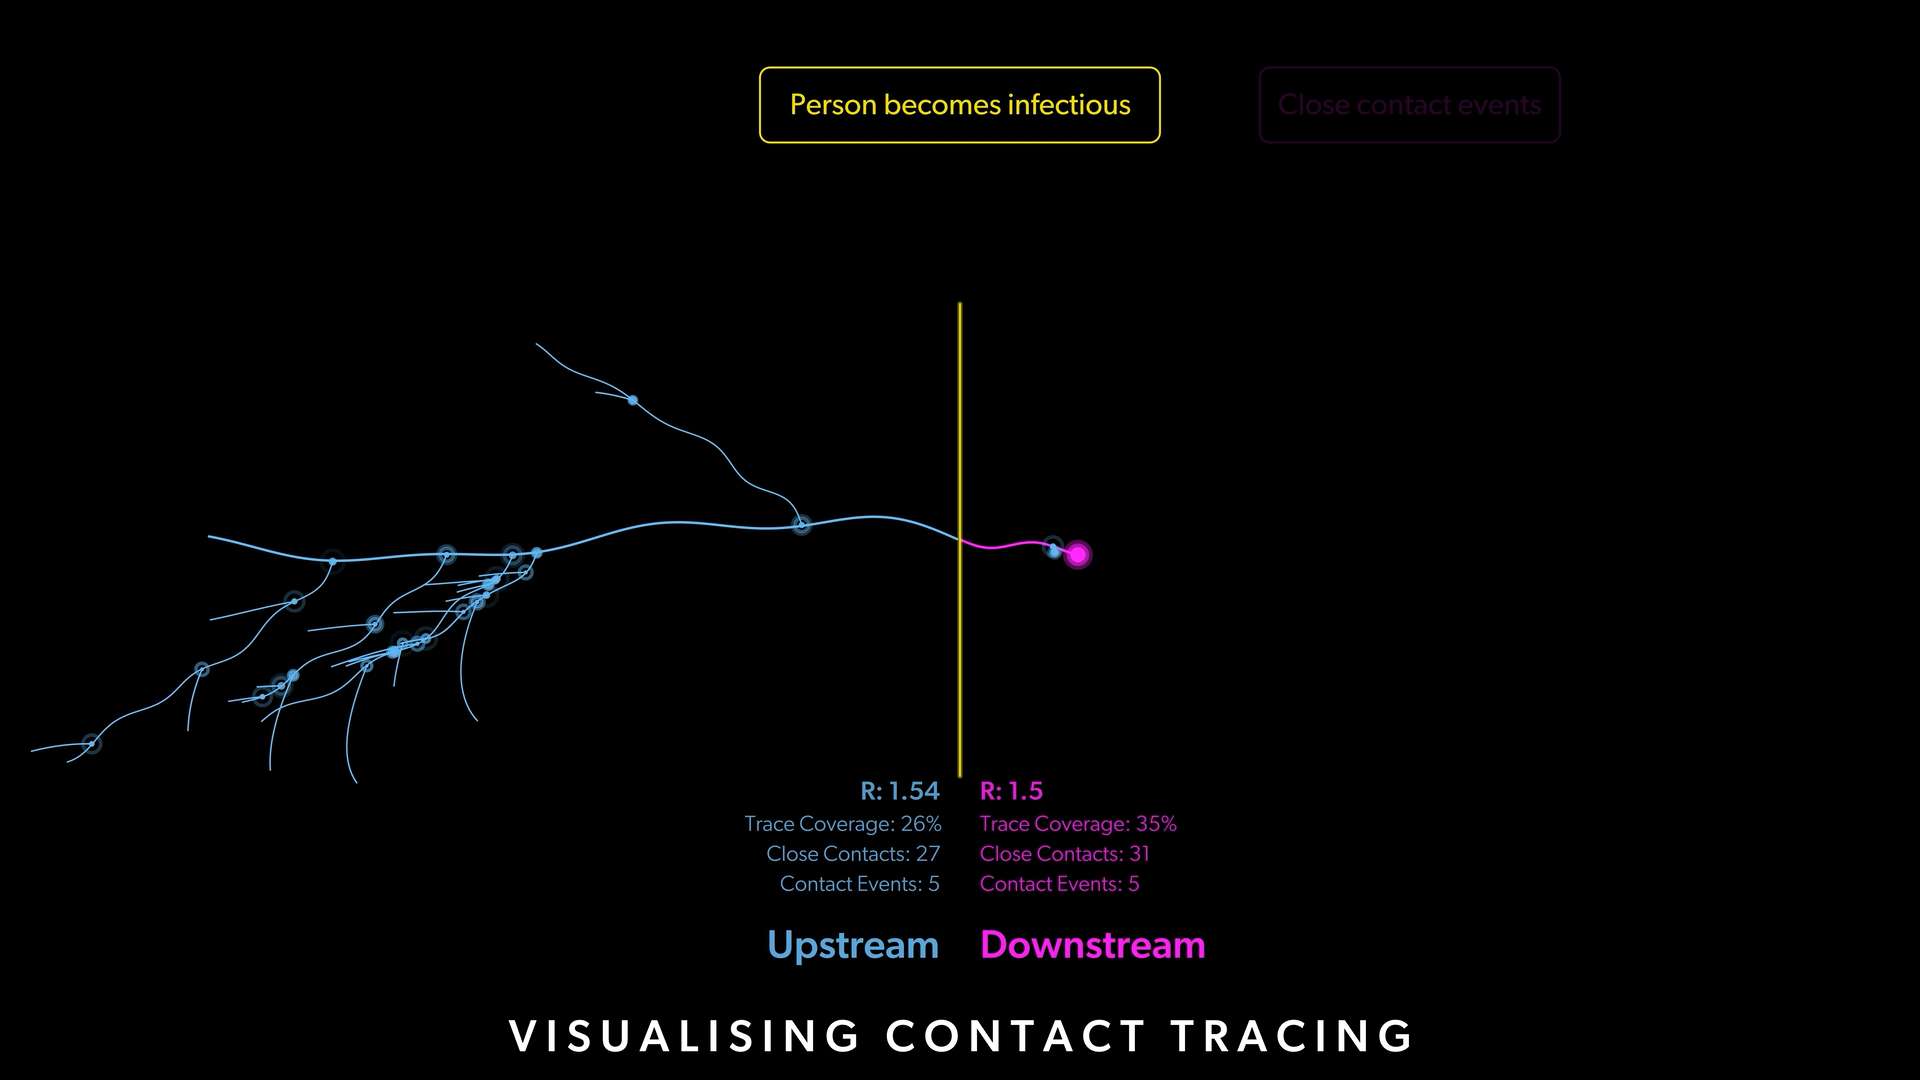
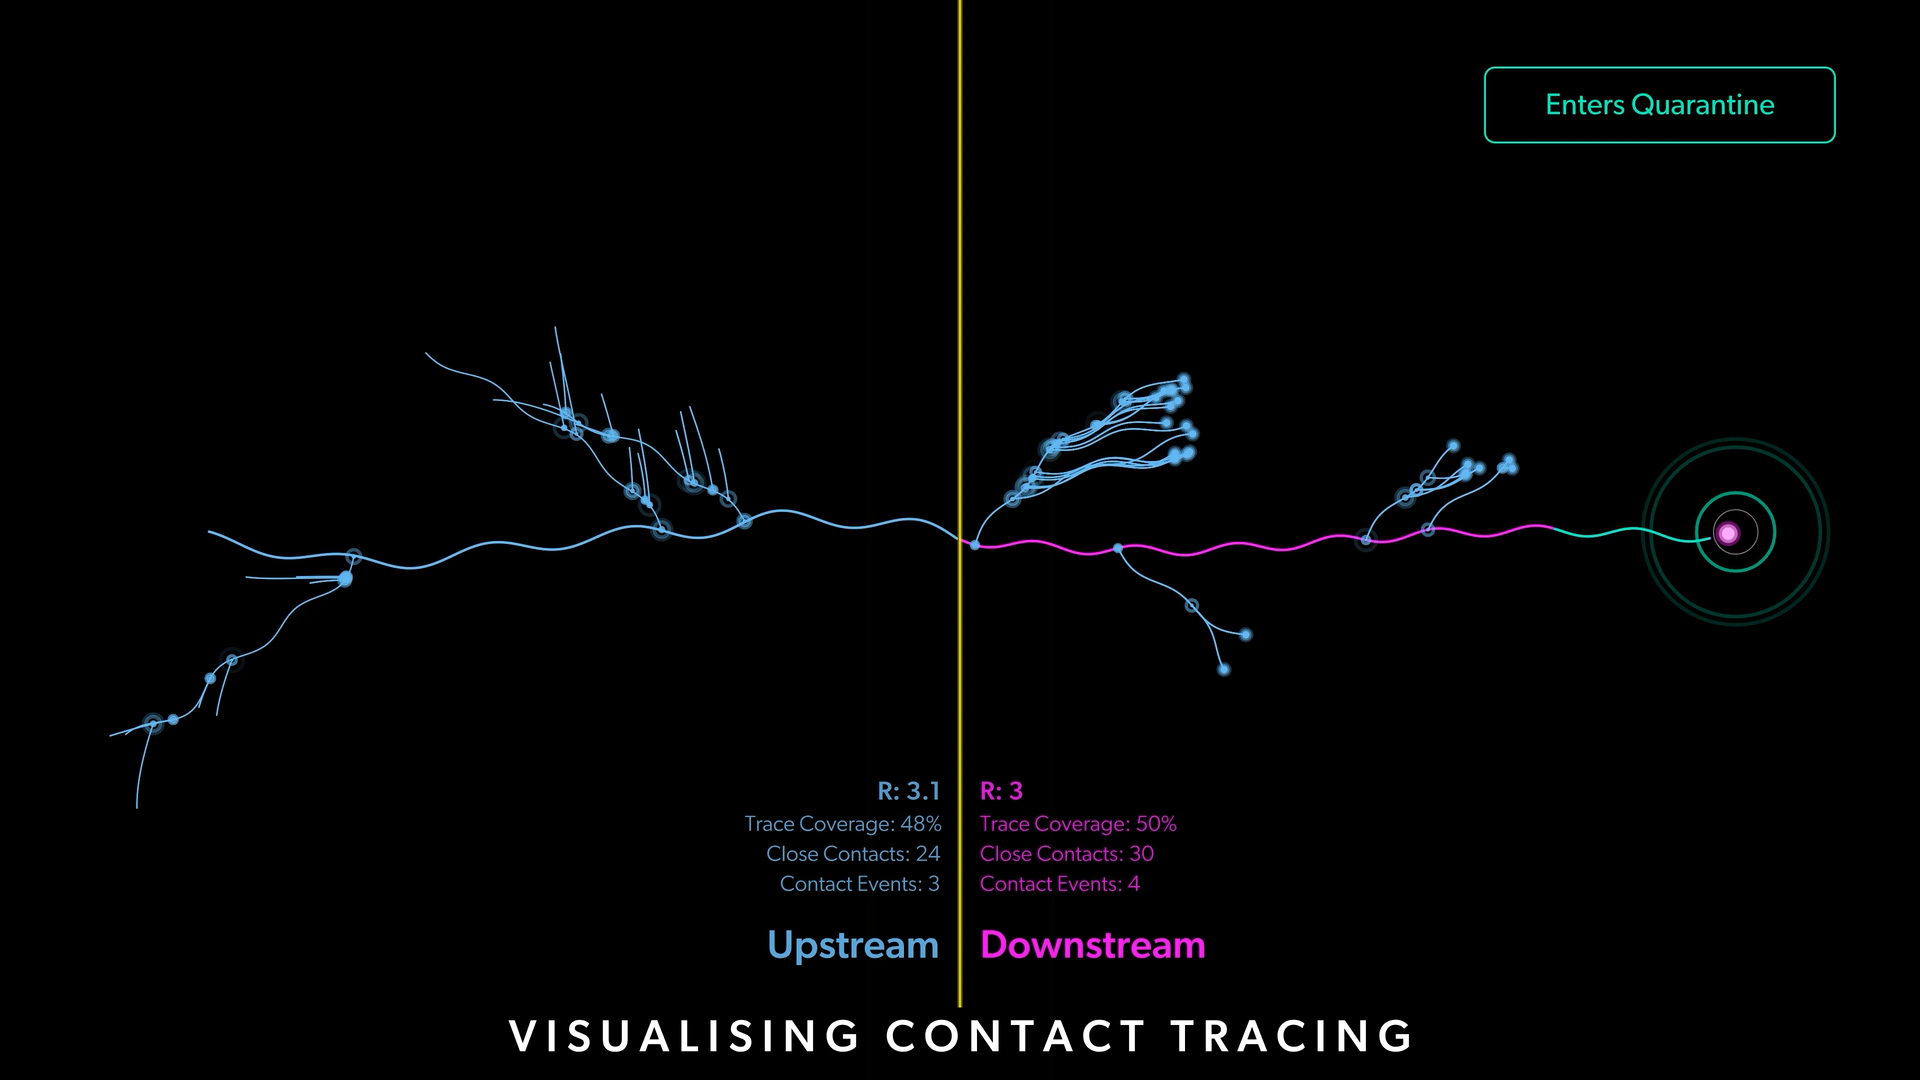
The tracing in these scenarios is divided into 2 stages, Upstream and Downstream. These refer to the circumstances before and after a person becomes infectious.
ANU After Dark at Enlighten
Stills
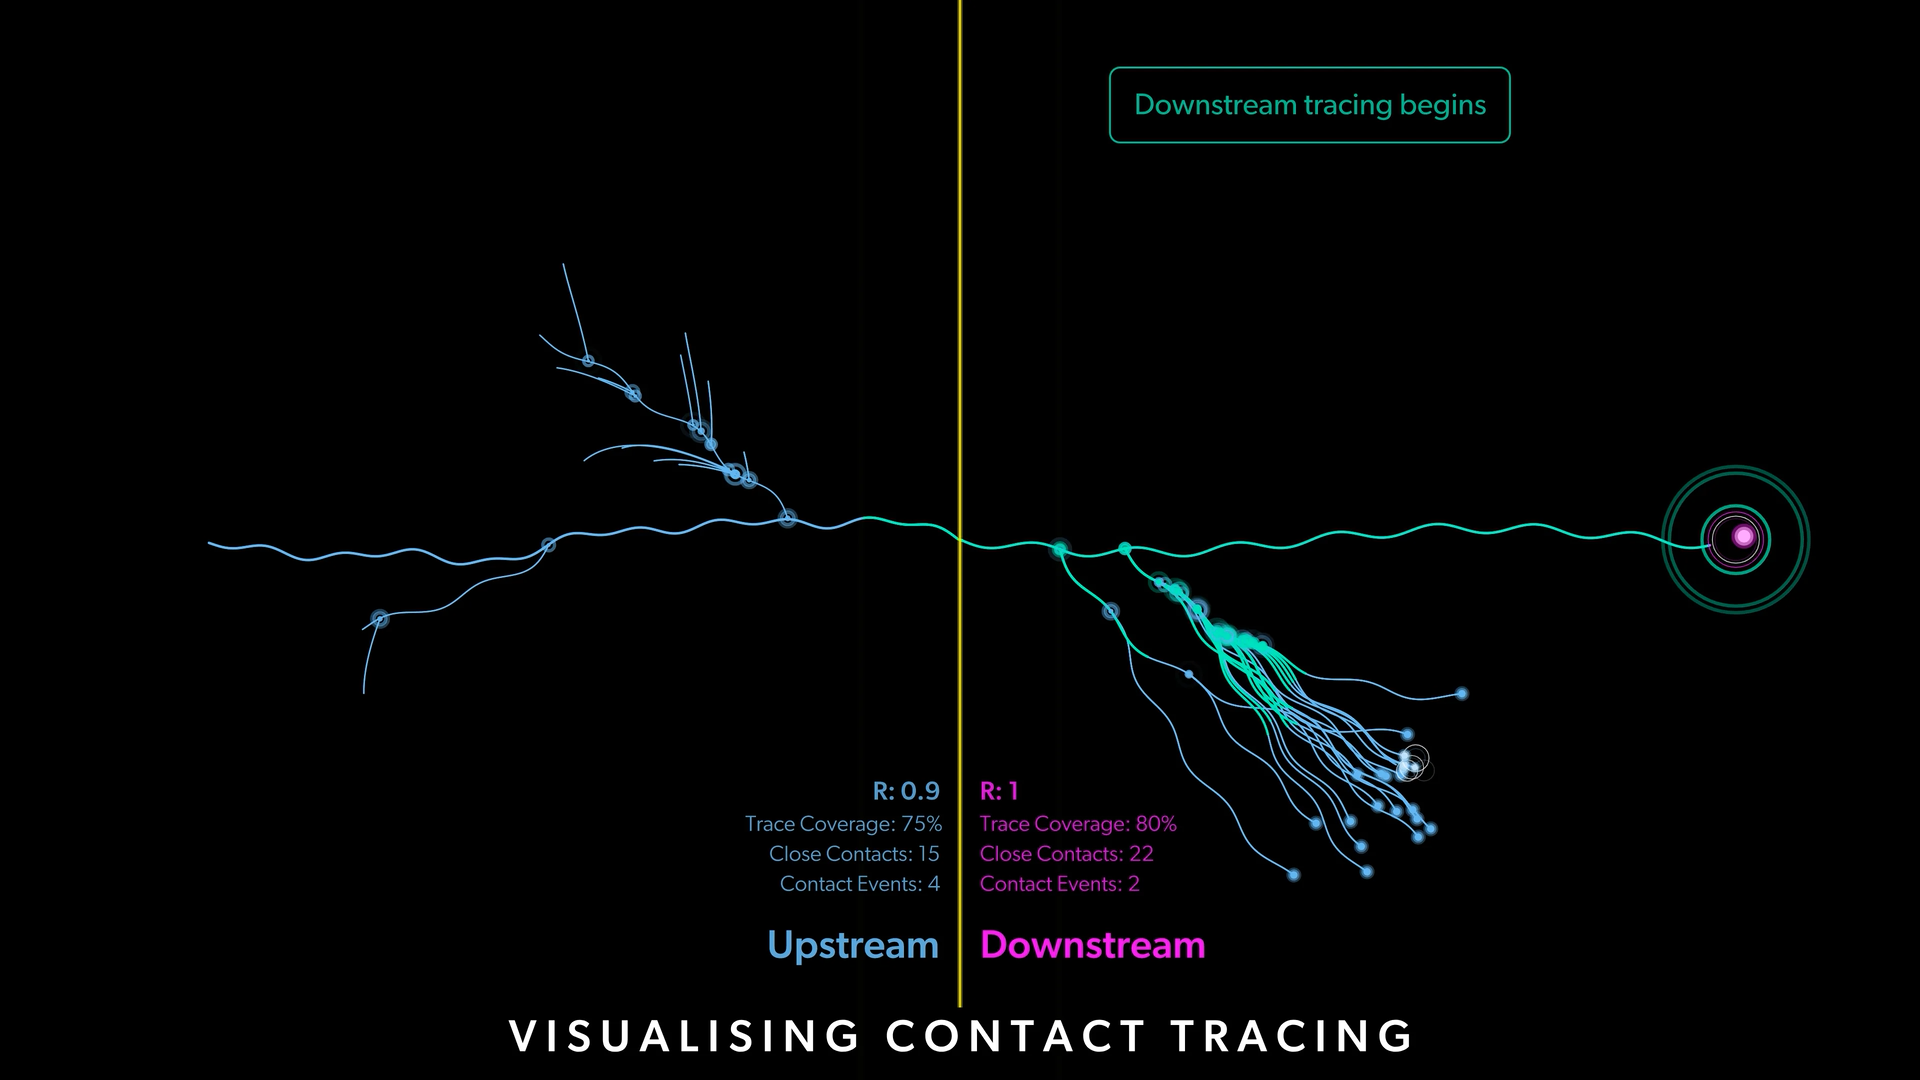
R = 1
R = 1.5
R = 3
The final step for this project is to develop it as an interactive web application.